Interband tunneling current in a highly-doped nitride heterojunction
Header
- Files for the tutorial located in nextnano++\examples\tricks_and_hacks:
InterbandTunneling_Duboz2019_nnp.py
InterbandTunneling_Duboz2019_nnp.in
- Important output files:
bias_xxxxx/integrated_density_electron.dat
bias_xxxxx/integrated_density_hole.dat
bias_xxxxx/mobility_electron.dat
Introduction
We compute interband tunneling current through a highly-doped heterojunction by nextnano++ simulation and Python post-processing. We follow the methods in the following publication of Jean-Yves Duboz and Borge Vinter [Duboz2019], using fewer approximations wherever possible:
This tutorial uses the Python script nextnanopy/templates/InterbandTunneling_Duboz2019_nnp.py to automate the simulation of the nextnano++ input file InterbandTunneling_Duboz2019_nnp.in and post-calculation of interband tunneling current.
The script
The Python script does the following while sweeping the bias:
Runs the nextnano++ simulations based on the user-defined parameters
From the simulation output folder, load the envelopes \(F_{\mathrm{vj,z1}}(z)\), \(F_{\mathrm{vj,z2}}(z)\), and \(F_{\mathrm{ci}}(z)\) together with the electrostatic potential \(\phi(z)\). The units are 1/nm1/2 and V, respectively.
Differentiates the potential.
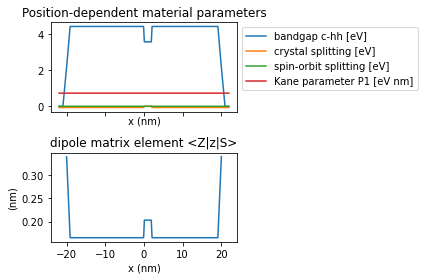
Calculates the dipole matrix elements using the position-dependent material parameters.
Plots the matrix elements as a function of position.
Integrates the product over the device.
Calculates tunneling current density for individual transitions in units A/cm2.
Sums up the tunnel current density for all possible transitions.
After all simulations and post-calculations, the Python script exports the tunnel I-V curve in the following formats:
Image file with the format specified by the user
*.dat file
The output folders are indicated in the console log. The *.dat format is useful if you compare I-V curves using the nextnanomat overlay feature.
Options in the script
- Effective ffield
If the Boolean variable
CalculateEffectiveField_fromOutput = True(the default), then the script calculates the position-dependent effective field\[M_{ij}^{\sigma} =\alpha_{Z\sigma}^{j*} \int\frac{P_1}{E_g}F_{vj,z\sigma}^{*}(z)F_{ci\sigma}(z) q\frac{\partial\phi(z)}{\partial z} dz\]based on the computed electrostatic potential. When
CalculateEffectiveField_fromOutput = False, the assumption in the paper is used.\[\frac{\partial\phi(z)}{\partial z} = 1 \mathrm{\frac{V}{nm}}\]- Kane’s parameter
If the Boolean variable
KaneParameter_fromOutput = True(the default), then the script reads in the Kane’s parameter \(P\) in from the nextnano++ output to evaluate\[\bra{Z} z \ket{S} = \frac{1}{E_g} \bra{Z} p_z \ket{S} = \frac{P}{E_g}\]In this case, an 8-band \(\mathbf{k} \cdot \mathbf{p}\) simulation with exactly the same device geometry will be performed so that nextnanopy can extract the Kane parameter.
If
KaneParameter_fromOutput = False, then \(P\) is calculated from the assumption in [Duboz2019] (\(E_P\) = 15 eV).- Reduced mass
If the Boolean variable
CalculateReducedMass_fromOutput = True, then the script calculates the position-dependent reduced mass \(m_r\) in\[I_{ij} = \frac{2\pi q}{\hbar} \sum_\sigma |M_{ij}^\sigma|^2 \cdot \frac{m_r}{2 \pi \hbar^2} = \frac{q m_r}{\hbar^3} \sum_\sigma |M_{ij}^\sigma|^2\]using the nextnano++ outputs of the effective masses.
When
CalculateReducedMass_fromOutput = False(the default), then the assumption as in [Duboz2019] is used.
Results
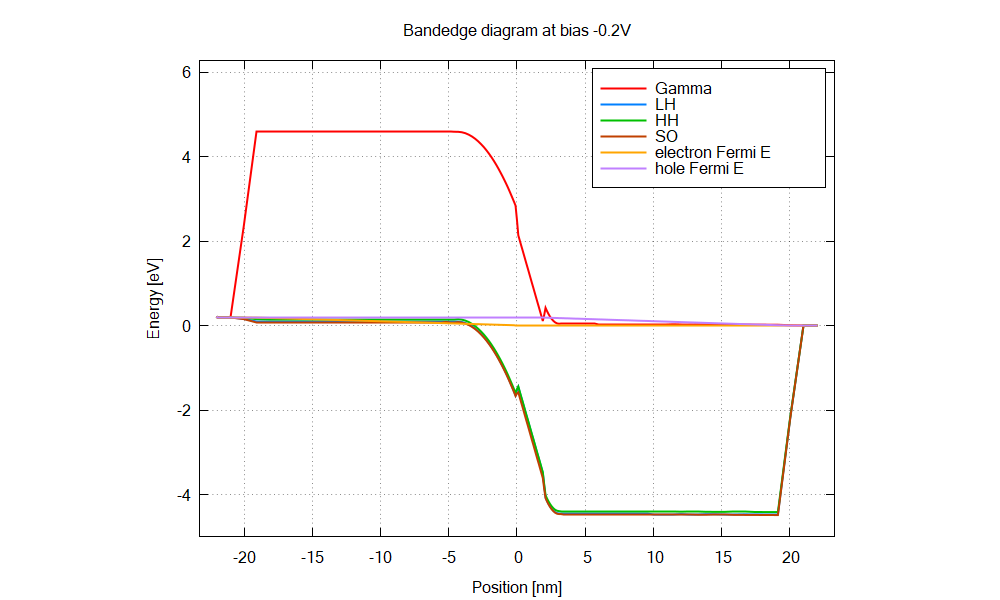
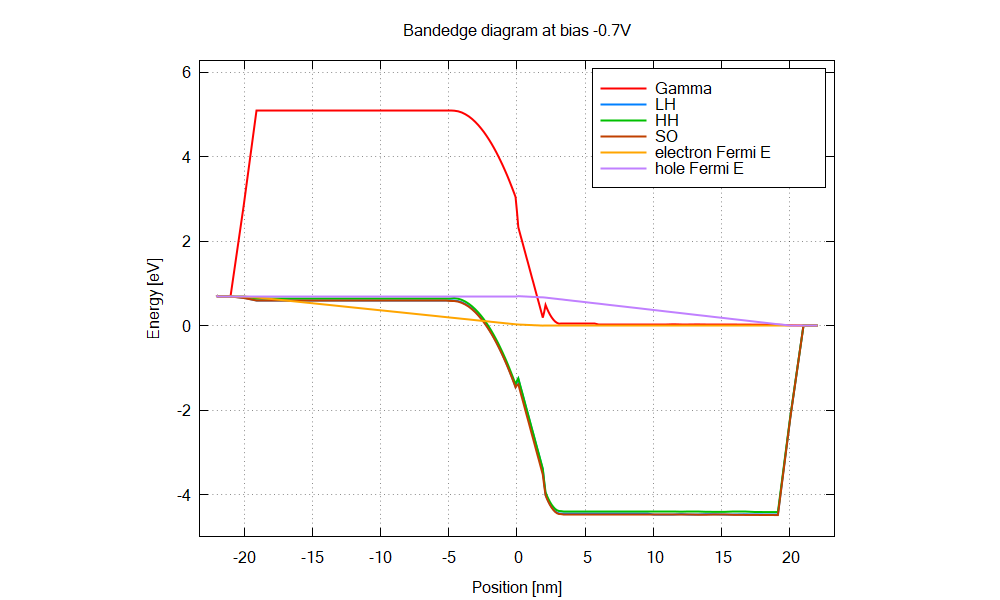
The structure is an AlGaN/GaN p-i-n junction with 2 nm GaN interlayer.
The energy overlap between the hole states and electron states increases as the bias, leading to larger tunnel current.
The Python script calculates dipole matrix elements from the simulation results:
from which we obtain the tunnel current as a function of bias:
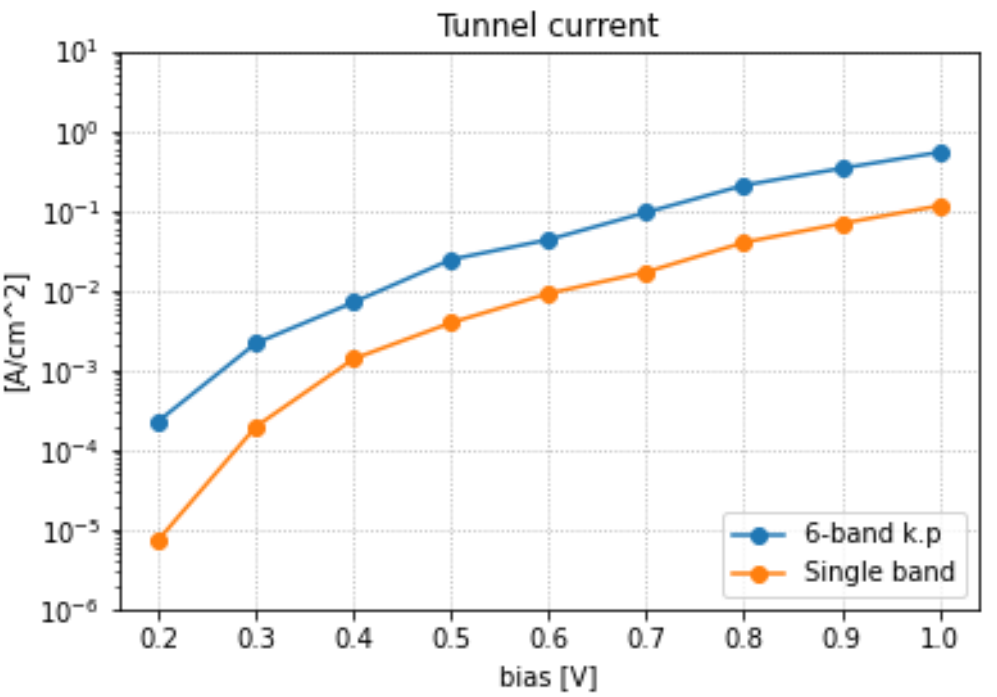
Figure 2.4.18.3 Interband tunneling current in a nitride p-i-n junction. Following the paper, backward bias is taken to be positive in this plot.
Last update: 17/07/2024